
LOCATION DATA · 50.1033, 14.4458
A standardized base of European location data
Six core layers: demography, modelled mobility, purchasing power, points of interest, competition, and catchment areas. Documented, regularly updated, and extended with additional data when needed.
Modelling location data for European enterprises since 2015
CORE DATA LAYERS
The foundation for every location decision, built to expand
Six core layers cover most location questions out of the box. Built to a single European standard, they combine cleanly and can be extended with additional data sources when needed.
DEMOGRAPHY
Who lives there
population · age · income
Population, age, and income modelled to a fine grid, so you know how many right customers are within reach, not just a postcode average.
MODELLED MOBILITY
Who passes through
daytime footfall
Modelled daytime and visitor presence, so you can tell where people actually spend time, not just where they live.
PURCHASING POWER
What they can spend
spend by category
Spending capacity by household and category, so demand is measured in real money, not just headcount.
POINTS OF INTEREST
What's around it
retail · transit · anchors
Retail, services, transport, and nearby anchors, the traffic generators that shape how a location actually performs.
COMPETITION
Who else is there
branches · density
Competitor locations and density by brand, so you can assess the real gap in a market before committing to it.
CATCHMENT CONTEXT
The area it serves
drive-time areas
Realistic walk and drive time catchments, the area a location genuinely draws from, not a radius on a map.
BEYOND THE CORE
Extend with more sources
Add your own data, partner feeds and specialist layers to the same standard, so the base grows with the decision, not against it.
WHY TEAMS STRUGGLE WITH LOCATION DATA
The analysis is rarely the problem. The inputs are
Too coarse
Postcode and district averages smooth over the few hundred metres where a site actually succeeds or fails.
Sources don't align
Mobility from one vendor and demography from another rarely match, so each analysis opens with a fight over whose numbers to trust.
Stale and manual
Hand-assembled feeds take weeks to build, break at the next refresh, and are hard to defend when someone asks where a figure came from.
WHAT MAKES IT DEPENDABLE
One European standard
All six layers built to the same classification, so a result in Prague compares directly with Vienna or Warsaw.
Documented method
The inputs, model and assumptions behind each layer are written down, so analysts know exactly what a figure represents.
Defined refresh
Every layer is updated on a published schedule and stamped with the release date it carries.
Quality-checked
Each release is validated against the previous version before it reaches you.
Modelled mobility
LAYER METADATA
Source
Mobile + census, modelled
Method
Documented · versioned
Refresh
Quarterly
Coverage
Europe-wide
Released
2026 · Q2
Every layer carries this record
CREDIBILITY
Built for European enterprise decisions
MODELLING LOCATION DATA
Since 2015
10+ years building and maintaining these layers for European enterprises. It is the core of what we do.
ONE CLASSIFICATION
Europe-wide
Every layer built to the same standard, so figures compare directly from one market to the next.
HOW TEAMS USE IT
EVALUATE
Site evaluation
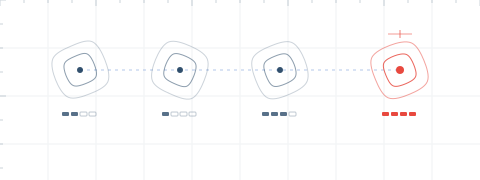
Score every shortlisted site on the same six layers, so candidates are compared on identical evidence, not on who knew the area best.


WHY NOT STITCH IT TOGETHER
The data exists. Making it hold together is the work
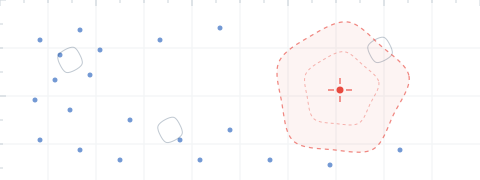
Open data, GIS layers and bought-in dashboards each get you part of the way. The work is making them align, stay current and stay defensible, which is exactly what a standardized base removes.
| Traditional GIS | BI dashboards | CleverMaps | |
|---|---|---|---|
| Coverage | Layers you assemble country by country | Whatever the dashboard vendor ships | Six layers to one European standard, nothing to reconcile |
| Alignment | Classifications you reconcile by hand | Generic data you wire up yourself | Modelled together, so the layers combine cleanly |
| Upkeep | You refresh and reconcile every source | Tied to the vendor's refresh cycle | Modelled, refreshed and quality-checked by us |
| Defensibility | Hard to trace months after the decision | Method hidden inside the tool | Source, method and date recorded on every layer |
30-MINUTE WORKING SESSION
Run it on a real market or site shortlist
Bring a market you're weighing or a shortlist of sites. We'll show you the six layers we hold for them (demography, mobility, spend, points of interest, competition and catchments), and how a team turns them into a decision.