


What Is the Huff Model?
The Huff Model (also known as the Huff Gravity Model) is a method used in location intelligence to estimate the probability that a customer will choose a particular branch. It primarily considers the customer's distance from each branch and the branch's attractiveness. Companies use it when planning branch networks, opening new branches, closing locations, and evaluating the impact of network changes. So how can you make the most of it in practice?
How Can I Determine Which Branch My Customer Belongs To?
Which branch does your customer belong to? For some customers, the answer is obvious: they consistently visit one specific location over a long period of time. However, many customers do not have a clearly defined home branch. They alternate between branches, use different service points, or there is simply not enough information about their behavior. The Huff Gravity Model is particularly useful for these customers.
Figure 1: When to Use the Huff Model
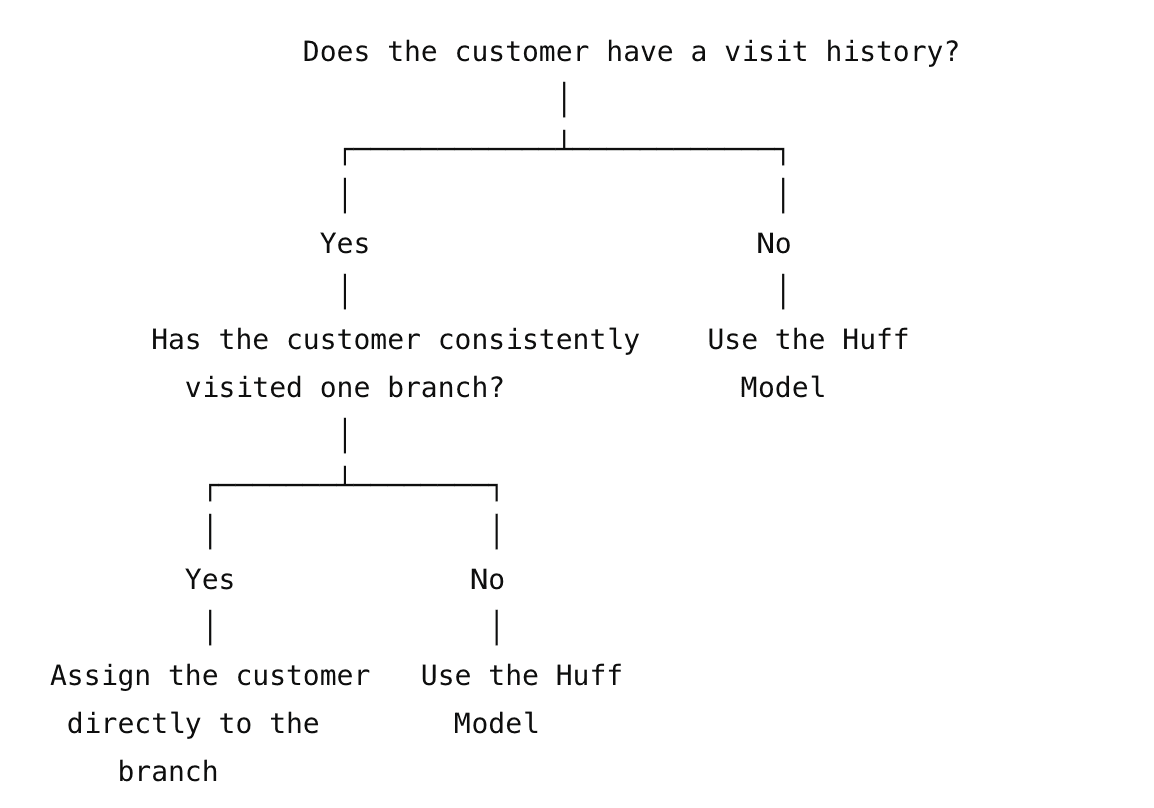
Figure 1: The Huff Model is not necessary for every customer. If historical data clearly identifies the customer's preferred branch, they can be assigned directly to that branch.
Is the Nearest Branch Always the Customer's First Choice?
Simple analyses often assume that a customer belongs to the nearest branch. In reality, however, customers may prefer a branch that is farther away because it is larger, easier to access, offers more services, or is located somewhere they regularly visit.
The Huff Model therefore considers two key factors:
the customer's distance from the branch,
the branch's attractiveness.
Attractiveness may include factors such as available services, capacity, opening hours, branch size, number of employees, facilities, or the characteristics of the surrounding area.
Unlike simple trade area definitions, the Huff Model does not assume that customers always visit the nearest branch. Instead, it calculates the probability of visiting every relevant branch.
How Does the Huff Model Work?
The principle behind the Huff Model is similar to gravity: the closer and more attractive a branch is, the stronger its "pull" on the customer. The model then estimates the probability that the customer will visit each branch. The result may either assign the customer to a single branch or distribute probabilities across multiple locations.
The model can include not only your own branches but also competitor locations. This makes it better reflect real customer decision-making, where people choose between multiple alternatives.
Figure 2: How the Huff Model Works
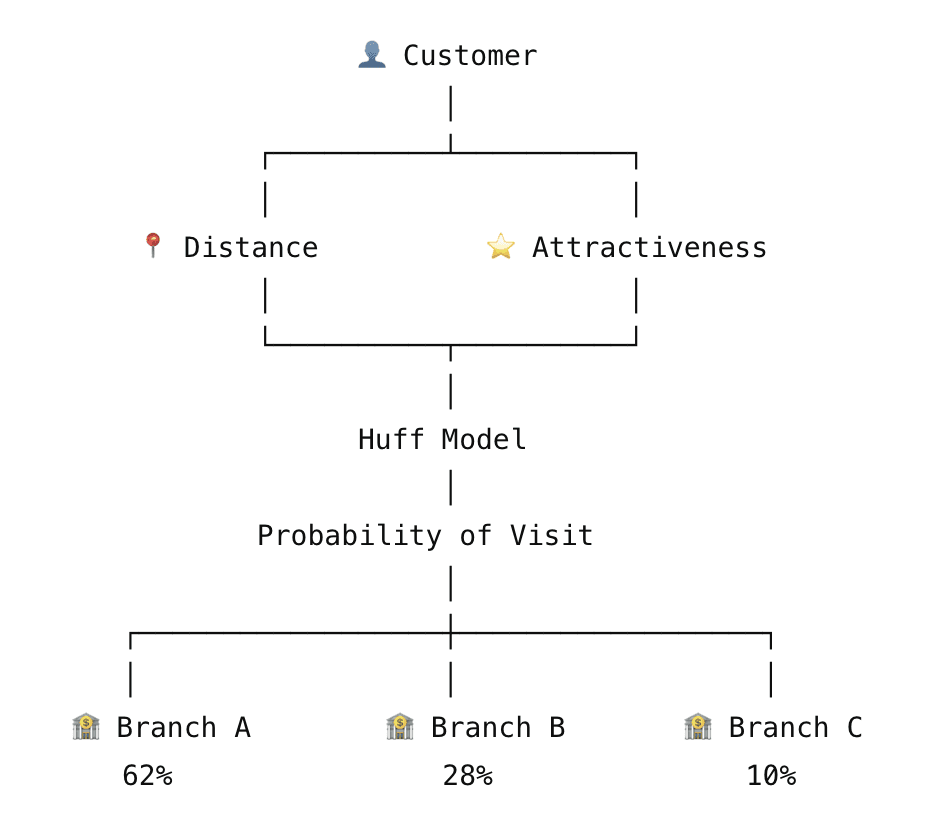
Figure 2: The Huff Model combines distance and branch attractiveness to calculate the probability that a customer will choose each branch.
Not Every Customer Needs to Be Included in the Huff Model
If historical data clearly shows that a customer consistently uses one specific branch, they can simply be assigned directly to that branch. The Huff Model is primarily intended for customers who:
visit multiple branches without a clear preference,
use multiple service points,
use services outside physical branches,
or have no available visit history.
The model fills the gaps where transaction or visit data alone cannot provide a clear answer.
What Data Does the Huff Model Use?
The following data can be included in the Huff Model calculation:
existing and proposed branch locations,
customer or population locations,
branch characteristics, facilities, and services,
historical visits and other customer interactions,
competitor branches,
spatial data on accessibility and surrounding areas.
The specific inputs always depend on the industry and the available data.
How Is the Huff Model Calculated?
The Huff Model is a well-established spatial analysis method used to estimate the probability that a customer will choose a particular branch. The calculation is based on the attractiveness of individual branches, their distance from the customer, and all other available branches in the surrounding area.
Figure 3: The calculation of the Huff Model
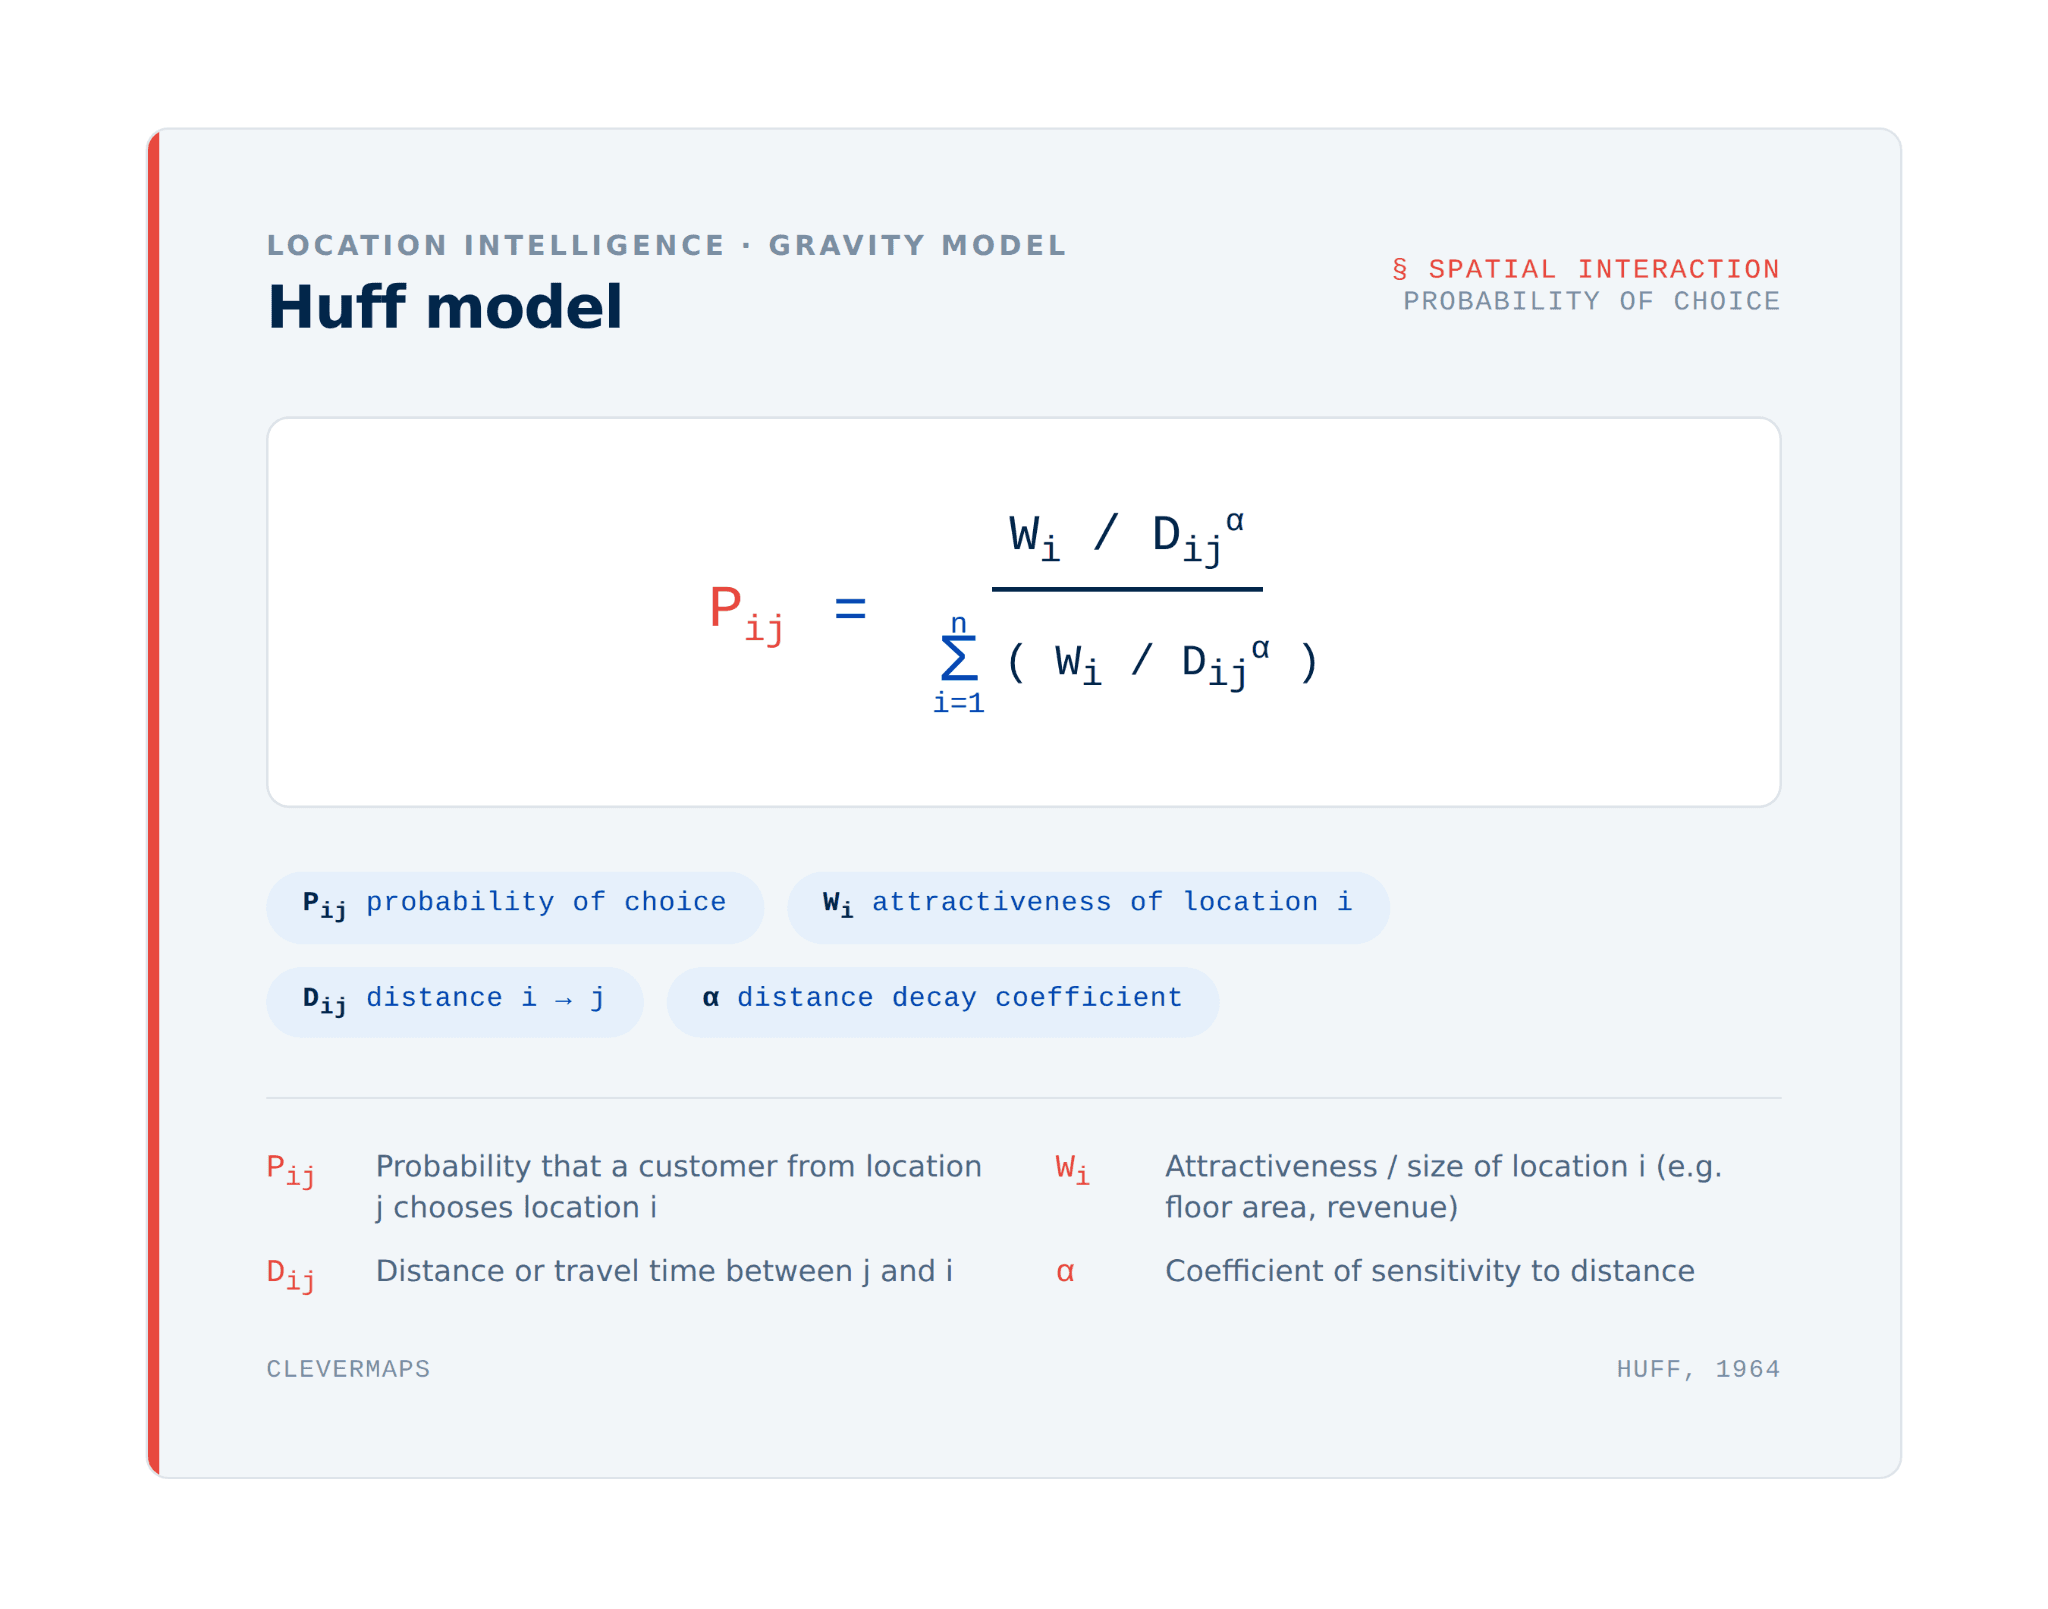
Does this sound complicated? The good news is that modern location intelligence applications, such as Network Impact Modeling by CleverMaps, perform the entire calculation automatically. The results are then displayed in interactive maps and dashboards.
When Is the Huff Model Used?
The Huff Model supports decision-making across an entire branch network. It is commonly used for:
opening new branches,
closing locations,
relocating branches,
optimizing branch networks,
modeling trade areas,
estimating branch market share,
planning sales and service networks.
What Happens to Customers When the Branch Network Changes?
The Huff Model is also useful for scenario planning. Companies can test the impact of opening, closing, or relocating a branch and determine:
how many customers a new branch could attract,
where customers from a closed branch are likely to move,
how the workload of nearby branches will change,
which parts of the network will be affected the most.
For example, a bank can identify which nearby branches will absorb customers from a branch before it is closed, and whether any of those branches may become overloaded. Likewise, a retail chain can estimate whether a new store will attract new customers or simply shift traffic away from nearby stores.
Why Is It Worth Modeling Branch Network Changes?
Modeling helps companies make decisions based on data rather than assumptions. It enables organizations to:
reduce cannibalization between branches,
plan branch capacity more effectively,
target marketing more accurately,
identify underserved areas,
estimate the impact of changes before implementation.
What Does the Huff Model Produce?
The output of the Huff Model is much more than identifying one "correct" branch. The model can show:
the probability of customers visiting each branch,
the expected number of customers at each branch,
changes in trade areas,
customer movement after opening or closing a branch,
branch utilization,
the impact on market share or business performance.
The results can be visualized in interactive maps and dashboards, making it easy to compare the current state with a proposed scenario.
Figure 4: Huff Model output for branch network modeling in CleverMaps.
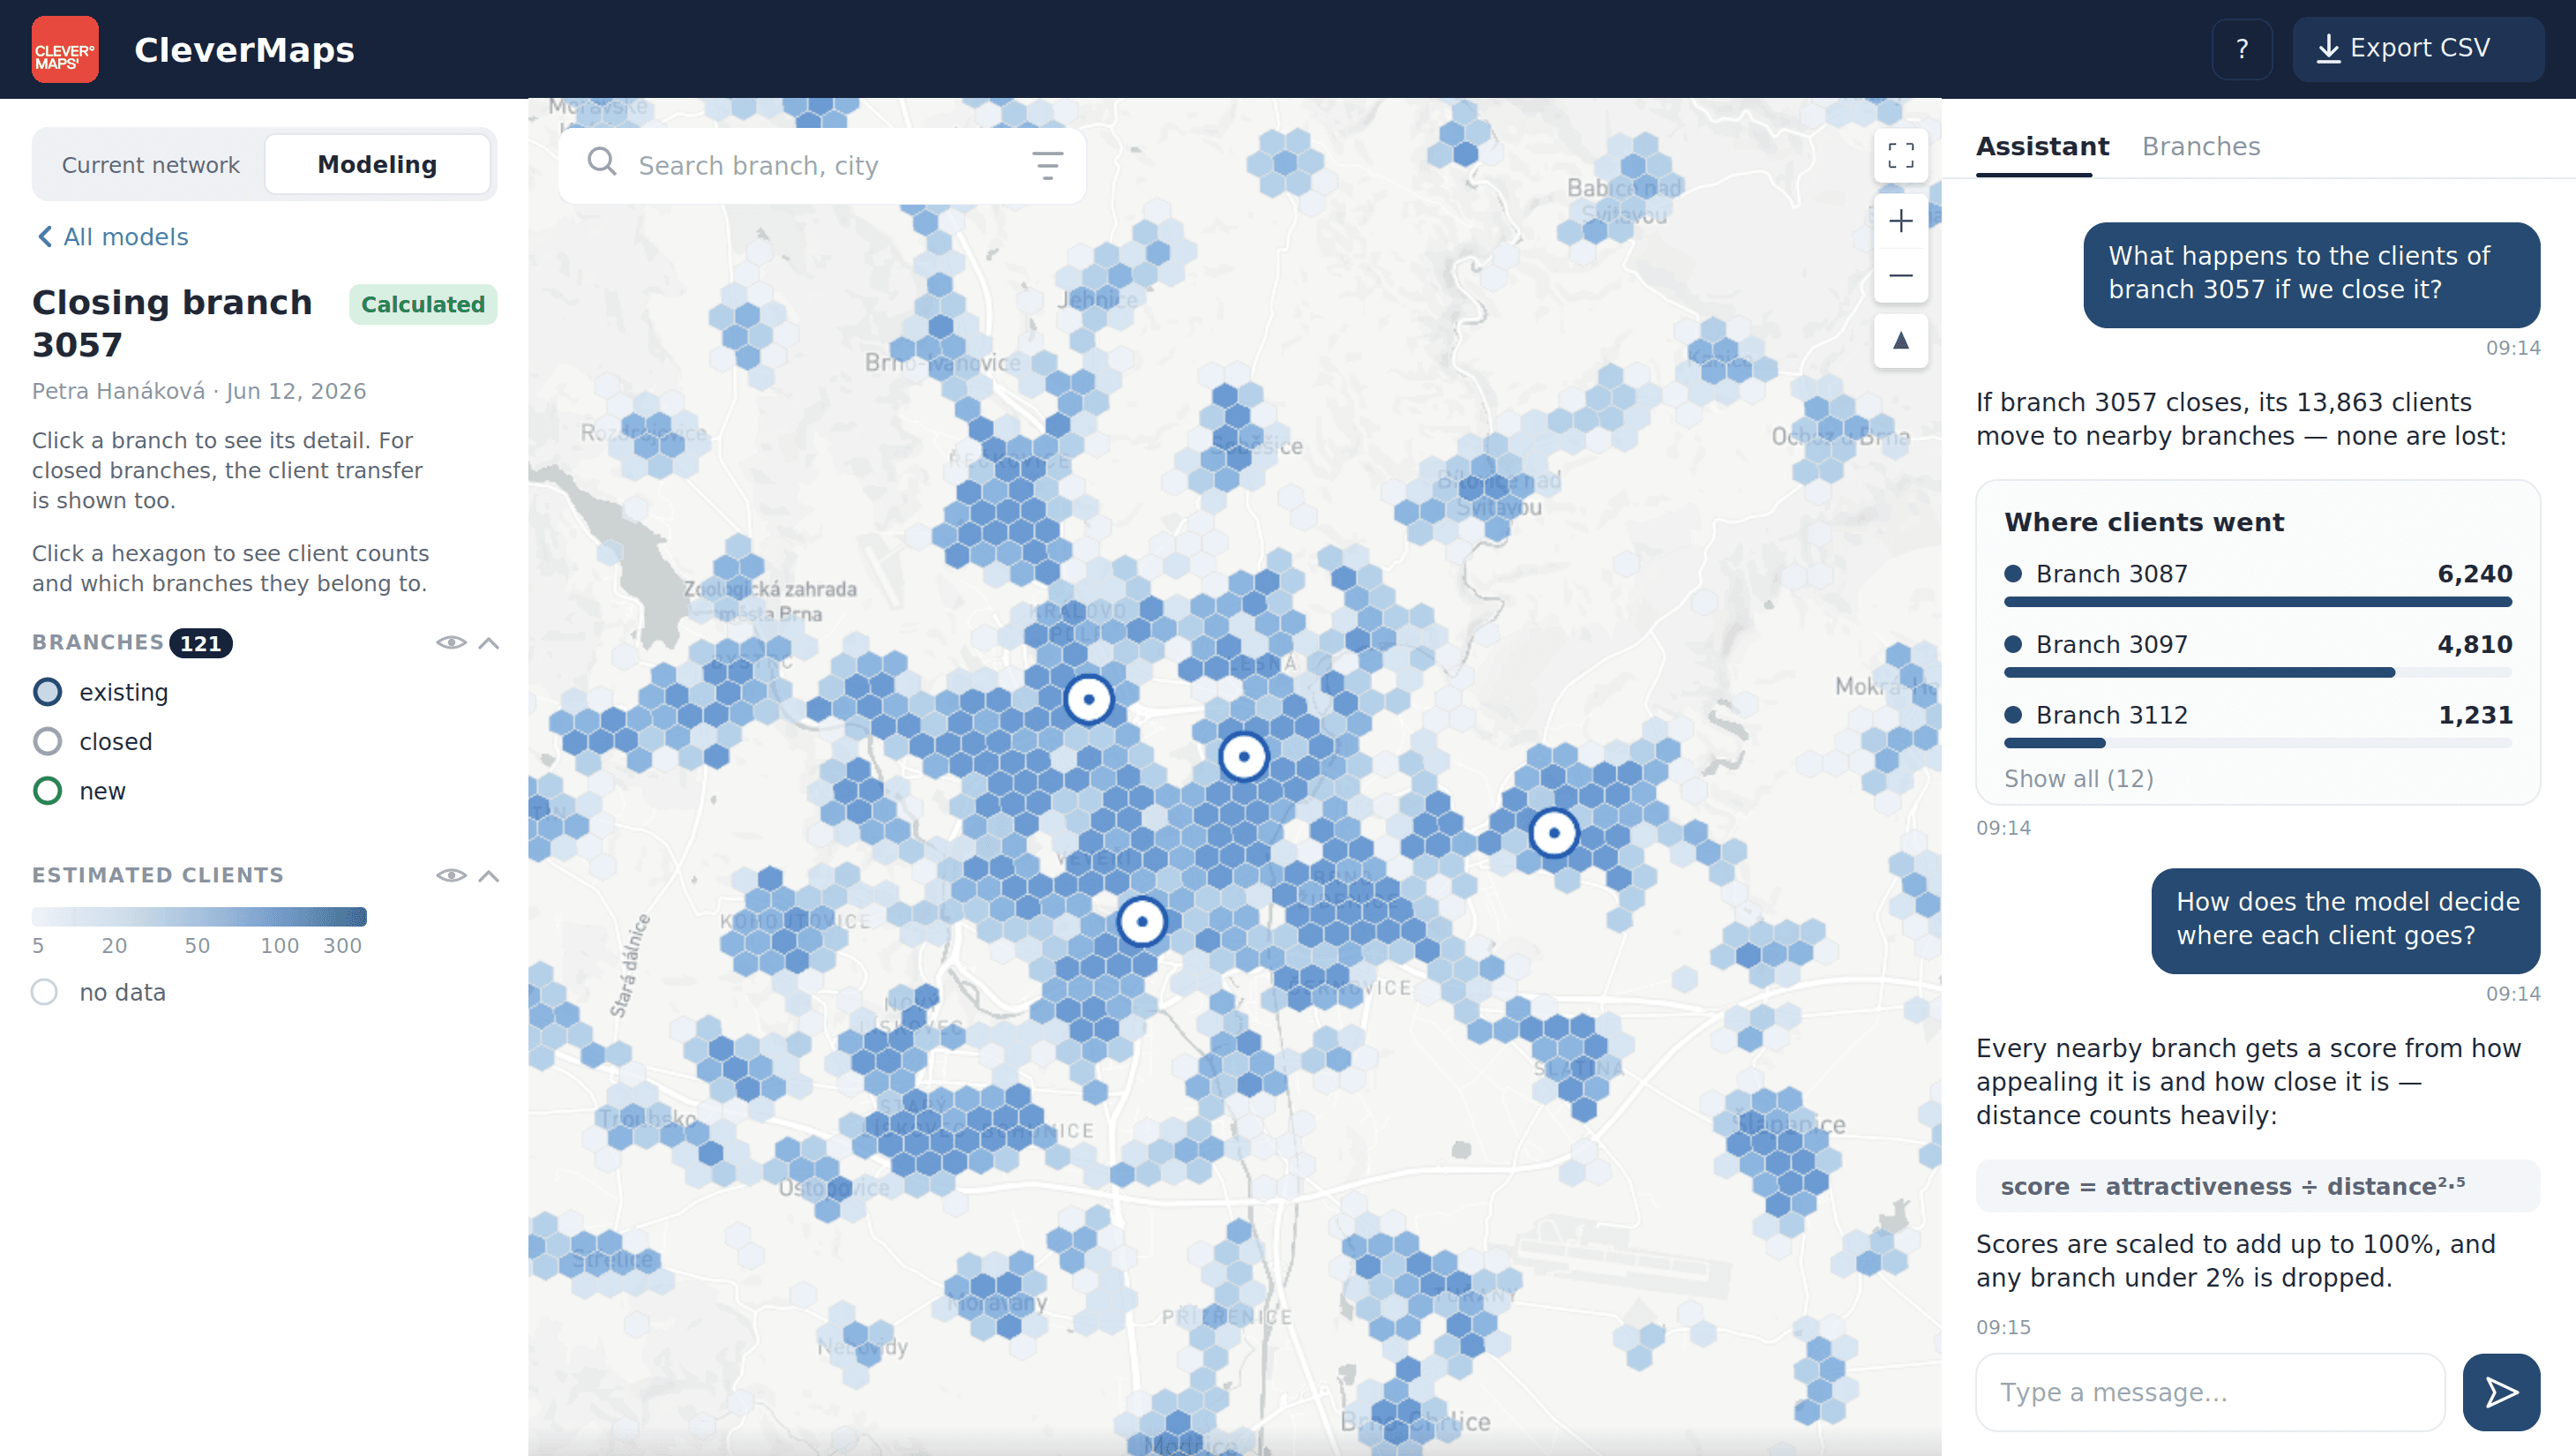
Figure 4: What the Huff Model looks like in practice and its visualization in a preconfigured Network Impact Modeling application by CleverMaps.
Frequently Asked Questions About the Huff Model
What questions do our clients ask us most?
Is the Huff Model a Gravity Model?
Yes. The Huff Model, also known as the Huff Gravity Model, is a type of gravity model used in spatial analysis and location intelligence. It estimates the probability that a customer will choose a particular branch based on two main factors: the branch's attractiveness and its distance from the customer. Like other gravity models, it assumes that more attractive locations have a stronger pull, while the likelihood of a visit decreases as distance increases.
What Is the Difference Between the Huff Model and a Catchment Area?
A simple catchment area typically assumes that customers visit the nearest branch. The Huff Model assumes that customers evaluate multiple options and that their decision is influenced not only by distance but also by the attractiveness of each branch.
How Accurate Is the Huff Model?
Accuracy depends on the quality of the input data and the correct calibration of the model parameters. When high-quality data on customers, branches, and branch attractiveness is available, the model can provide highly accurate estimates of actual customer behavior.
Can the Huff Model Be Used Outside Retail?
Yes. The Huff Model is also widely used in banking, insurance, healthcare, logistics, and the public sector. Anywhere people choose between multiple physical locations.
How Can the Huff Model Be Applied in Practice?
The Huff Model helps organizations make data-driven decisions about their branch networks. It can be applied in banking, retail, logistics, healthcare, and any industry where customers choose between multiple physical locations.
Would you like to see what happens to your customers when your branch network changes?
Book a demo, and we'll show you how similar scenarios can be modeled using your own data.