

CANNIBALISATION ANALYSIS · NETWORK DECISIONS
Cannibalisation, measured before it happens
Know how much of a new site’s revenue would come from your own network, which existing sites overlap today, and what the network actually keeps.
WHY OVERLAP GOES UNNOTICED
Revenue you take from yourself never shows up as theft
When a new site takes sales from a sister site, the network total barely moves. The damage hides inside two mediocre P&Ls instead of one honest number.
The new site always looks fine
Openings are judged on their own revenue. Nobody asks how much of it simply walked over from the store down the road.
The victim gets blamed, not the cause
The older site’s decline is explained by management, staff or weather. The real cause opened 800 metres away, a year earlier.
Totals hide the bleeding
Network revenue can grow while pair after pair of sites quietly split the same customers. Averages absorb the loss.
Nobody owns the trade-off
Expansion wants the new site, operations defends the old one, and no shared number says what the network actually gains.
HOW OVERLAP IS HANDLED TODAY
Openings judged on their own P&L
Overlap noticed a year later, if ever
Anecdotes about stolen customers
No agreed threshold for acceptable overlap
Expansion and operations arguing past each other
WITH CANNIBALISATION ANALYSIS
Every pair of sites checked for shared catchment
New sites carry a projected cannibalisation number
Net network gain decides, not gross revenue
Agreed thresholds by format and market
One number both teams argue from
DETECT · PROJECT · DECIDE
From gut suspicion to a net-gain number
One analysis workflow. Today’s overlaps detected across every pair of sites, tomorrow’s projected for every candidate, and decisions made on net network gain. The thresholds stay agreed, the arguments stay short.
DETECT · TODAY’S OVERLAP
Find the pairs eating each other
Catchments computed for every site on one model
Shared-catchment pairs ranked by severity
Trends watched as your network and rivals shift
OVERLAP RANKING · TOP PAIRS
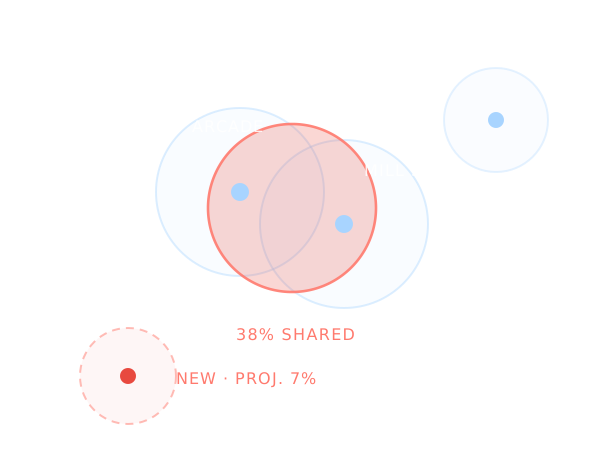
Arcade × Mill St
Station pair
Parkside pair
PROJECT · EVERY CANDIDATE
Price the overlap before you build
Projected cannibalisation for each candidate site
Net gain after overlap, not gross forecast
Alternatives tested a street further out
Projections run on Network Impact Modelling, the same gravity logic that models client absorption after closures.
CANDIDATE · RIVERSIDE
Projected cannibalisation
7%
Net network gain
+11%
Nearest own site
22 MIN
ACCEPTABLE · WITHIN THRESHOLD
DECIDE · ON NET GAIN
Approve on what the network keeps
Thresholds agreed per format and market
Openings, relocations and closures use one basis
The overlap review repeats as the network grows
REVIEW · Q3
Arcade × Mill St
GO
Station pair
PLANNED
Parkside pair
MONITOR
NET GAIN POSITIVE · NETWORK HEALTHY
WHAT DRIVES OVERLAP
Why two nearby sites can thrive, and two distant ones collide
Distance is a poor predictor of cannibalisation. Two sites a kilometre apart can serve different worlds, while two on the same commuter line share half their customers. What matters is how demand actually flows.
Overlap is computed from gravity-modelled catchments calibrated with trusted location data and your own transactions, so shared customers are estimated from real behaviour, not radius circles. Every pair and every candidate reads from the same basis.
SCORE COMPOSITION
What moves an overlap estimate, by market type
Dense urban
Suburban
SHARED FLOW
Customers whose routines touch both sites
88
84
DISTANCE DECAY
How quickly willingness to travel drops
90
38
BARRIERS
Rivers, rails and roads that split demand
62
90
FORMAT SIMILARITY
How interchangeable the two offers are
80
52
ABSORPTION
What each site could absorb from the other
66
72
MARKET HEADROOM
How much new demand the area still has
70
55
Dense urban: shared flow decides
Suburban: distance decay decides
SAMPLE WEIGHTS · CALIBRATED ON YOUR TRANSACTIONS
THE PAYBACK
What measured overlap changes
EXPANSION QUALITY
New sites add revenue the network keeps
Candidates carry a projected overlap number, so growth is judged on net gain and the pipeline stops funding its own decline.
NETWORK HEALTH
Colliding pairs get fixed, not explained
Detected overlaps become consolidations, relocations or format changes instead of two underperforming P&Ls.
ALIGNMENT
Expansion and operations share one number
With agreed thresholds, the opening debate becomes a comparison against a standard instead of a turf war.
BEYOND RADIUS CIRCLES
A radius on a map is not a catchment
RADIUS RULES
Good for a quick look, wrong at the edges
A fixed no-closer-than rule ignores barriers, flows and format. It blocks good sites and waves through bad ones.
P&L REVIEWS
Good at finding victims, a year late
Revenue reviews spot the damage after it happened. By then the lease is signed and the loss is structural.
GROSS FORECASTS
Good headline numbers, silent on the source
A forecast that ignores your own nearby sites cannot say how much revenue is simply moving between them.
FIELD ANECDOTES
Good stories, impossible to settle
That store steals our customers may well be true. Without a shared model it is just the loudest voice in the room.
CLEVERMAPS
Overlap as a number, not an argument
Shared catchments detected, projected and held against agreed thresholds on one gravity model of your network. Part of the Performance solution.
Cannibalisation analysis is part of the Performance solution, built on trusted location data and shared decision logic.
MEASURED IN THE REAL WORLD
Proven on dense networks

FEATURED CASE STUDY
The data science behind Dr. Max parcel locker expansion
Dr. Max expanded its parcel locker network with overlap checked before every batch, so new boxes added pickups instead of splitting them with boxes already running.
PHARMACY RETAIL · OOH NETWORK
ALSO IN RETAIL NETWORKS
Optimization of branch network using location insights, with TETA
Read the story →
30-MINUTE WORKING SESSION
Bring the pair you argue about
In 30 minutes we will compute the shared catchment of any two of your sites, or project the overlap of a candidate you are weighing, on your own data.