

SITE SELECTION · EXPANSION DECISIONS
Site selection that survives the investment committee
Score every candidate location against demand, competition and your own network, verify the shortlist in the field, and walk into the approval meeting with evidence instead of opinion.
WHY SITE SELECTION GOES WRONG
The expensive mistakes hiding in expansion plans
An expansion plan is only as good as its weakest opening. One wrong lease binds capital for years, while the right corner one street away goes to a competitor.
A good market is not a good site
Demand two streets away does not cross a busy road. Catchments and daily routines decide what a location actually captures.
The model says yes, the street says no
The model can love a site that fails the moment you stand on it. That has to surface in the field visit, not after the fit-out.
New sites that eat your own revenue
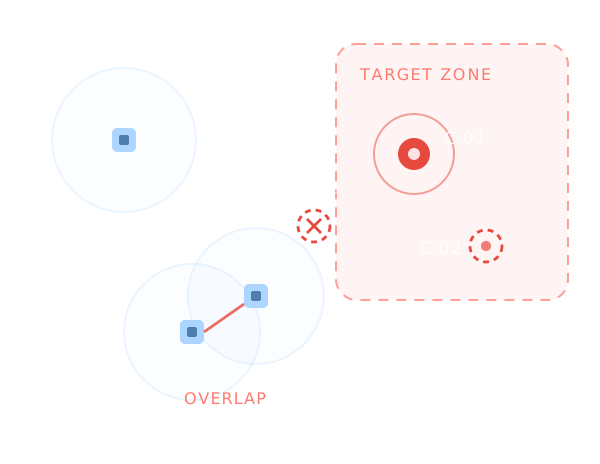
Open next to your own store and the new revenue is partly your old revenue. Cannibalisation only shows up later, in the older site’s decline.
Every region argues from a different spreadsheet
HQ plans centrally, regions judge locally, and criteria drift between files. Decisions end up running on seniority instead of evidence.
HOW MOST SITE DECISIONS RUN TODAY
A broker deck and a gut feeling
Every region with its own criteria
A consultant study for the biggest bets
Cannibalisation found in next year’s numbers
Site visits that never reach the model
WITH A SITE SELECTION SYSTEM
Catchments, demand and competition quantified first
One scoring model for every candidate and region
Overlap with your own estate checked before the lease
Field verification wired into the same site record
A shortlist the investment committee can interrogate
SCREEN · VERIFY · SIGN
From market screen to a site you can sign
Site selection as one continuous workflow, not a study. Analysts screen markets and rank candidates, expansion managers send the shortlist to the field, and the committee decides on evidence all three share.
IN THE OFFICE · SCREEN
Screen the market, build the shortlist
Find white spaces and target zones worth entering
Put every candidate on the same scorecard, whatever the format
Rank the pipeline by net contribution to the network
CANDIDATE RANKING
Market square
Mill district
Ring road
IN THE FIELD · VERIFY
Walk it before you sign it
Walk the site: frontage, entrance, visibility from the main flow
Judge the neighbours, parking and how people actually pass by
Reject candidates while walking away costs nothing
The shortlist travels in CleverMaps Field, so what the surveyor sees lands in the site record, not in an email thread.
SITE CHECK · MILL DISTRICT
Frontage fits the format
OK
Entrance at street level
OK
Seen from the main flow
OK
VERIFIED · IN THE SITE RECORD
BACK TO DECISION · COMMIT
Take evidence to the committee
What the field saw reshuffles the ranking automatically
Approved sites move into the pipeline with their evidence attached
Each new market starts from the calibrated model, not from scratch
PIPELINE · WAVE 1
Market square
APPROVED
Mill district
APPROVED
Ring road
REJECTED
TWO LEASES TO SIGN · WAVE 2 SCORING
WHAT DECIDES THE SCORE
What separates a winning site from the lookalike next door
No single number makes a site. Footfall, catchment spending, access and competition pull in different directions, and their balance shifts with the format: a high-street unit lives on passing traffic, a retail-park unit on households and parking.
Calibration runs against your own estate: the model learns how your existing sites perform on trusted location data joined with your sales, then reads every candidate across catchments from 200 m up to a 10-minute drive. Underperformers, relocations and new openings all read from the same page.
SCORE COMPOSITION
What moves a site score in each format
High street
Retail park
DEMAND
Catchment population and spending
88
84
FOOTFALL
Passing traffic and daily routines
90
38
ACCESS
Reachability, parking and transit
62
90
ATTRACTION
Commercial strength of the spot
80
52
OVERLAP
Cannibalisation of your own network
66
72
COMPETITION
Competitor density and strength
70
55
High street: passing traffic and spot quality decide
Retail park: households and car access decide
SAMPLE WEIGHTS · CALIBRATED TO YOUR ESTATE
WHAT CHANGES
Three things the expansion pipeline gains
EXPANSION BUDGET
Capital goes to sites that earn it
Weak candidates die in scoring or in the field, before a lease binds capital for years. The pipeline that reaches the committee is already filtered.
NETWORK REVENUE
Growth without eating your own stores
Every approval includes the overlap check, so new openings are measured on net new customers, not on volume borrowed from your own estate.
ANALYSTS + COMMITTEE
Committees decide faster on shared evidence
Analysts, expansion managers and the board read the same scorecard, so approval meetings argue about strategy, not about whose spreadsheet is right.
INSTEAD OF THE USUAL TOOLS
A market report will not defend your next lease
BROKER SHORTLISTS
Good for deal flow, weak for comparability
A broker brings sites, not evidence. Every recommendation arrives with different numbers, so candidates cannot be compared on one basis.
SPREADSHEETS
Good for tracking, weak for judging
Candidate lists drift apart by region, and a spreadsheet cannot see two candidates sharing a catchment.
BI DASHBOARDS
Good for hindsight, weak for the next decision
Dashboards explain the estate you already have, not the corner you are about to bid on.
ONE-OFF STUDY
Good for one wave, weak for a pipeline
A market study answers last spring’s question. An expansion pipeline asks it again every quarter, in every region.
CLEVERMAPS
One system from screening to signature
Screen, score, verify and approve in one place, with every site decision documented back to the data behind it. This is the workflow at the heart of the Growth solution.
Site selection is the core workflow of the Growth solution, built on trusted location data and shared decision logic.
IN PRACTICE
Proven on real expansion decisions

FEATURED CASE STUDY
How to identify the stores with the highest growth potential
Albert scored growth potential across 300 stores on one shared model, showing which locations deserve investment and where the network still has room to grow. The same logic now guides expansion decisions.
RETAIL · GROCERY NETWORK
ALSO PROVEN AT NETWORK SCALE
The data science behind Dr. Max parcel locker network expansion
Read the story →
30-MINUTE WORKING SESSION
Put one real site on the table
Pick one market or one candidate site you are weighing. In 30 minutes we will score it live against demand, competition and your own estate, and you will see the scorecard your committee would get.